The National Food Institute, DTU (WHO Collaborating Centre and European Union Reference Laboratory for Antimicrobial Resistance in Foodborne Pathogens and Genomics) has spent the autumn 2016 interpreting the huge abundance of sequencing data generated. Antimicrobial resistance classes and genes have been identified for each of the samples. Various plots have been created to visually output the abundance profiles for each sample / country (read count matrixes). In conjunction with the identification of the antimicrobial resistance classes and genes, the epidemiological data captured through the survey have similarly undergone analysis categorizing the sample sites into groups.
National Institute for Public Health and the Environment, RIVM (WHO Collaborating Centre for Risk Assessment of Pathogens in Water and Food) has analyzed the samples for antimicrobial residues, which will be the proxy for inadequate global usage data.
Early in 2017, RIVM and DTU will jointly interpret all the data generated, the abundance of AMR genes, the residue data, the epidemiological data, and other health parameters to explain the findings.
Erasmus MC in the Netherlands is still working on sequencing the samples to identify viruses. We anticipate sharing the findings as soon as they become available.
Please contact Rene Hendriksen (rshe@food.dtu.dk) if you are interested to receive the read count abundances of identified resistance genes.
Preliminary results of identified antimicrobial resistance classes and genes for each of the samples.

Ordination of Global Sewage resistomes. The read count matrix (genes by samples) was standardized using the Hellinger transformation. The Bray-Curtis dissimilarity indexes between all samples were calculated and principal coordinate analysis (PCoA) was used to project the data so that distances approximate inter-sample dissimilarities. Plotted samples are connected by convex hulls, highlighting geographical regions.
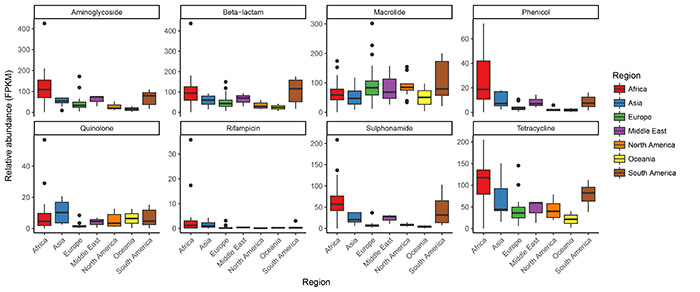
Boxplots of Global Sewage resistance by drug class and region. The read count matrix (genes by samples) was adjusted for gene lengths and sample sequencing depths so that relative abundance (fragments per kilobase reference per million fragments, FPKM) was obtained. Gene abundances within the same drug class were summed and are shown here separated by geographical region.
Preliminary results of identified antimicrobial residues for each of the samples.
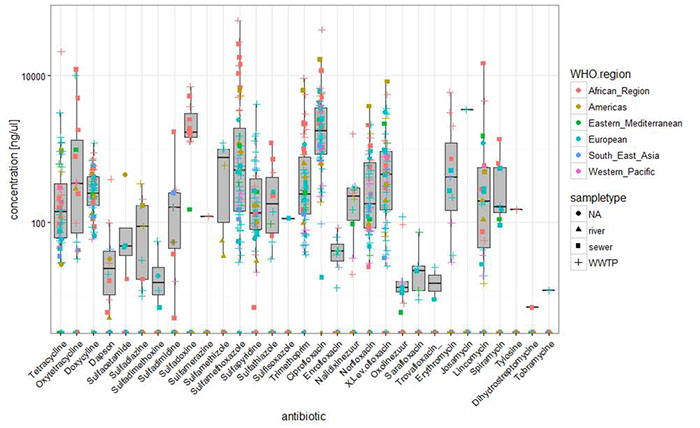
Results: Overall concentrations. This is a log-scale plot of antimicrobial residues. The highest concentrations are found often in open sewers.
Many compounds are not detected, such as beta lactams and cephalosporins, which are degraded before entering the sewers.